Power Quality Monitoring Devices: Recording Transient Voltage
Key Takeaways
- Power quality monitoring (PQM) devices are not uniformly regulated in how they measure power quality events.
- The intrinsic properties of transient voltage are unlike other power quality events, meaning PQM devices capturing other power quality events (i.e. voltage sags, voltage swells, or voltage interruptions) are not able to record transient events.
- PQMs must capture sufficient data points to accurately represent transient voltage waveforms.
- Inaccurate or missing data on transient voltage events can lead end-users to make decisions that do not accomplish their operational and reliability goals.
Introduction
As interest in power quality grows, many electrical and electronic equipment managers are using PQM devices. The power monitoring industry has responded to this demand by offering more user-friendly, compact, and affordable options. These new PQM devices have increased users’ adoption, leading to rapid growth in the PQM market in both the size and number of manufacturers. The challenge lies in the fact that most PQM devices are not designed to capture transient voltage events.
While Guides and Recommended Practices (references 8, 9, 10, 11) have been published for many power quality (PQ) events, references for capturing and recording transient voltage events using PQM devices are largely lacking. This has caused confusion and, in turn, misinformation in the market about the actual power quality experienced by end-users.
The value of PQM devices lies in analyzing and interpreting the vast amounts of data generated. Consequently, many PQM manufacturers are promoting their unique approaches to signal processing and artificial intelligence techniques.² Some claim their technology can capture and record transient voltage events without the traditionally accepted sampling rates of previous technologies; other manufacturers assert they can do so without providing supporting evidence. Regardless of the claims, these statements often fail to specify the types of transient voltage events their technology can or cannot capture. Moreover, empirical data reveals that some PQM manufacturers cannot capture and record transient voltage events, despite their claims.
Transient Voltage Properties
A transient voltage surge is a temporary voltage spike within an electrical circuit with a very short duration generally in millionths of a second. Transient voltage surges cause failures and misoperations in a variety of electrical and electronic equipment. There are three categories of transient voltage surges: impulsive, oscillatory, and Electronic Fast Transient (EFT Burst).
Impulsive Transients
An impulsive transient is a sudden deviation from the normal voltage and/or current conditions. This transient is unidirectional, either primarily positive or negative, and does not oscillate at the system frequency (e.g. 60 Hz or 50 Hz) or its harmonics. The most common cause of impulsive transients is lightning.⁸
Oscillatory Transients
An oscillatory transient oscillates with a primary frequency component between 500 Hz and 5 MHz and normally dies down within a cycle. These transients (also called switching transients) occur when an inductive or capacitive load is connected or disconnected, as in a motor or capacitor bank. An oscillatory transient occurs because the load resists the current or voltage change.⁸
EFT Burst
The EFT burst waveform consists of repetitive bursts, each containing individual unidirectional pulses. One possible source of electrical fast transients (EFT) is the arcing that can occur when mechanical contacts open during a switching process.⁹
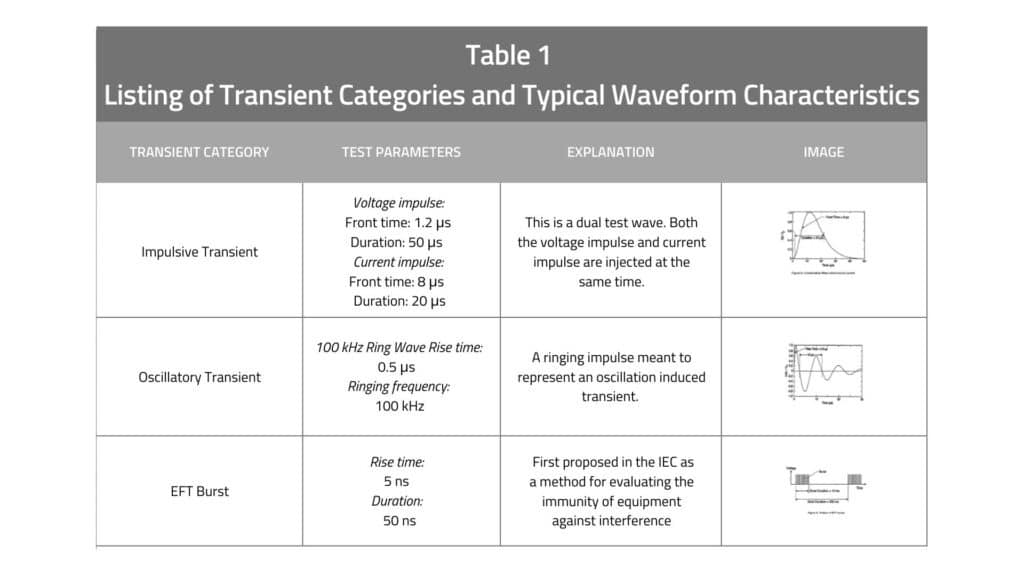
IEEE C62.41.2 simplifies these transient voltage waveforms and offers some measuring recommendations guidance, which can be found in Table 1.¹⁰
To accurately represent the status of a transient voltage waveform, PQM devices must capture sufficient data points. The short duration of transient voltage surges can lead to missed capturing and recording of transients if PQM devices utilize an inappropriate sampling rate.
How PQM Devices Function
IEEE Std. 1159-2019 defines PQM devices in this way:
“Terms such as power quality analyzer, power disturbance analyzer, PQ meter, PQ monitor and revenue meter with PQ have been used without formal definition in the industry for years, often interchangeably, to describe instruments that measure the parameters typically associated with the power quality phenomena.”⁸
The IEC 62586-1 Standard defines the term Power Quality Instrument (PQI) as an “instrument whose main function is to measure, record and possibly monitor power quality parameters in power supply systems, and whose measuring methods are defined in IEC 61000-4-30.”¹²
Generally speaking, PQM devices collect samples of the voltage and/or current and use a signal processor to create a waveform using a connect-the-dots methodology. The more samples taken, the more accurately the measured electrical waveforms will reflect the actual electrical waveforms. In other words, the higher a PQM devices’ sampling rate, the more accurate the data output. Slow sampling rates may miss important levels or Amplitudes.
Capturing relatively slow PQ events – such as sags and swells – is easier because their longer duration allows for sampling the voltage and current at relatively slow rates (e.g., 32 points per cycle) while still providing an acceptable depiction of the disturbance. Transient voltages occur in the nanosecond to microsecond range. To reliably capture and record these fast power disturbances, the voltage must be sampled many times within a microsecond.
PQM Device Criteria For Recording Transient Voltages
Sampling Rates
Since most PQ events have frequency contents below 5 kHz, many commercial PQM devices use sampling rates of 128 to 512 samples per cycle.¹ However, PQM devices with these sampling rates can only sporadically detect oscillatory transients and rarely capture their complete waveform or peak value. ⁵ ⁶
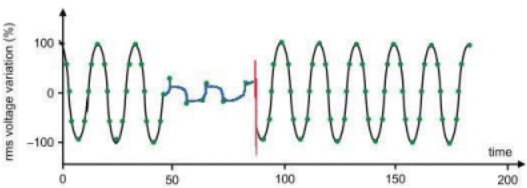
Impulsive transients are even shorter in duration, thus requiring much higher sample rates. If a PQM device with a sampling rate of 512 samples per cycle collects data only once every 32.5 microseconds, it is too slow to accurately characterize a 1.2×50-microsecond impulsive transient. See Image 1 for a graphical representation of this concept.
The PQM device used in Image 1 would have reported the sag event but missed the transient voltage event because the device did not sample at the precise moment when the transient occurred.
Even if the PQM device in Image 1 happened to randomly capture the transient voltage surge, the data associated with it could be less than accurate because the entire sequence of the transient event would have been averaged into a single data point instead of multiple data points. Consequently, the recorded data point may not represent the true peak voltage of the transient event.
Image 1: PQM Device with Low sample rate example

The blue event represents a sag; the red event represents a transient voltage event. The green dots represent the moments a PQM device samples the signal.¹⁵
*This image is not a direct representation of a sampling rate, but an illustrative representation that maintains a wide view of a sine wave.
Image 2: 1.2/50μs pulse at 256 samples per cycle

Image 3: 1.2/50μs pulse at 65 times faster than 256 samples per cycle

Images 2 and 3 display this phenomenon.⁴ Using a pulse generator, a PQM manufacturer created a 1.2/50 microsecond pulse and recorded the event with a 256 samples-per-cycle PQM device and another device 65 times faster. The PQM device in Image 2 showed a peak voltage just under 500V, while the faster PQM device in Image 3 recorded a peak voltage over 1100V. This discrepancy arises because the slower sampling rate did not capture enough data points to accurately represent the transient voltage event.¹⁵ This discrepancy clearly illustrates the need for high sampling rates in PQM devices to provide accurate data.
Additionally Consideration
While a high sampling rate provides some resolution, it alone is insufficient for accurately monitoring impulsive and oscillatory transients. The signal measurement path of a PQM device needs an adequate bandwidth (several MHz at least) and a wide voltage input range (at least 5 to 10 times the nominal system voltage).⁵ Additionally, the PQM devices’ transient monitoring performance depends on the implemented transient detection and triggering methods, recording techniques, and the capability for numerical processing and analysis of the captured transient events.
Conclusion & Recommendations
NEMA-reported data indicates that certain PQM devices relying on signal processing and artificial intelligence technology are incapable of capturing and recording transient voltage events.¹⁵ To truly understand how transient voltage is impacting an electrical system, PQM devices must obtain peak transient voltage measurements while also capturing more complete transient waveforms. The National Electrical Manufacturers Association recommends PQM devices with a sampling rate of at least several MSPS (Mega Samples per Second), a frequency bandwidth of several MHz, and a voltage input range of at least 10 times the nominal system voltage.¹⁵ UL 1449 counsels setting the measurement to capture at least 10,000 points (10 MSPS) with a time scale of 10 microseconds/division.¹¹ In case of instrument transformer use, give consideration to their high-frequency, phase, and magnitude response,⁷ ⁸ which could significantly impact the waveform processed by a PQM device.
Resources
1. R. C. Dugan, M. F. McGranaghan, S. Santoso, and H. W. Beaty, Electrical Power Systems Quality, McGraw-Hill Professional Engineering Series, McGraw-Hill, New York, NY, USA, 2nd edition, 2003.
2. Mark F. McGranaghan and Surya Santoso, Challenges and Trends in Analyses of Electric Power Quality Measurement Data, Hindawi Publishing Corporation, EURASIP Journal on Advances in Signal Processing, Volume 2007, Article ID 57985
3. MarketsandMarkets, Power Monitoring Market by Component (Hardware, Software, and Services), End-User (Manufacturing & Process Industry, Datacenters, Utilities & Renewables, Public Infrastructure, and Electric Vehicle Charging Stations), and Region – Global Forecast to 2022, www.marketsandmarkets.com/MarketReports/power-quality-meter-market-34696492.html
4. Chris Mullins, White Paper: Transient Capture vs. Waveform Capture, Power Monitors, Inc., July 2015
5. Square D / Schneider Electric White Paper: Transients in Power Systems, Part 1, September 2002
6. Square D / Schneider Electric White Paper: Transients in Power Systems, Part 2, September 2002
7. International Electrotechnical Commission (IEC) IEC Technical Report 61869-103 (2012), Instrument transformers – The use of instrument transformers for power quality measurement, Edition 1, May 2012.
8. IEEE Std. 1159-2019, Recommended Practice for Monitoring Electric Power Quality
9. IEEE C62.41.1, Guide on the Surge Environment in Low-Voltage (1000 V and Less) AC Power Circuits
10. IEEE C62.41.2, Recommended Practice on Characterization of Surges in Low-Voltage (1000 V and Less) AC Power Circuits
11. UL 1449, Standard for Surge Protective Devices
12. IEC 62586-1 (edition 2, 2017), “Power quality in power supply systems – part 1: Power quality instruments (PQI)”
13. IEC 62586-2 (edition 2, 2017), “Power quality in power supply systems – part 2: Functional tests and uncertainty requirements”
14. IEC 61000-4-30 (edition 3, 2015), “Electromagnetic compatibility (EMC) – part 4-30: Testing and measurement techniques – Power quality measurement methods”
15. National Electrical Manufacturers Association. (2021). Power Quality Monitors: From a Transient Perspective. NEMA VSP P3-2020.


